

Summarize this post with:
Last updated on May 24th, 2021 at 04:16 am
An untapped tool at an SEOs arsenal is Chrome’s Web Developer Tool.
The sheer amount of SEO insights that you can get out of this tool is simply amazing and yet a lot of folks in industry aren’t leveraging this amazing tool.
If by any chance you weren’t aware of Chrome DevTool’s capabilities in terms of offering you SEO insights then read this post till end because here you will learn ways in which this tool will assist you in creating killer SEO audits that will win you client’s trust and the project of course.
1. Detect Console JavaScript Errors

This is an essential thing to do while creating audits or analyzing the website for Technical SEO.
Googlebot cannot process JavaScript, all it cares about is HTML; what’s in the HTML is exactly what is responsible for ranking your website.
JavaScript becomes an obstruction in Google Bot’s way when it tries to perform a crawl, and the JavaScript errors can turn deadlier as it can block the content from loading properly and hence it is very important that these errors are rectified.
All you have to do to detect this is open chrome web developer tools by pressing ctrl + shift + I and then go to “Console” and then set the filter there to [Errors Only] that way you will only see javaScript Console Errors.
Now you can share these errors with the developer whose responsibility is to fix these errors.
2. Check for Content Cloaking
Content Cloaking is a black hat SEO practice that Google hates.
Google can even penalize your website if you are caught. Cloaking essentially means presenting a different information to Google Bot than what you are presenting to the users.
Sometimes website is made like this without any malicious intent, it could be due to a development glitch or maybe a headline is made to hide on Desktop and another is made available on Mobile and you wouldn’t be aware of this situation the whole time.
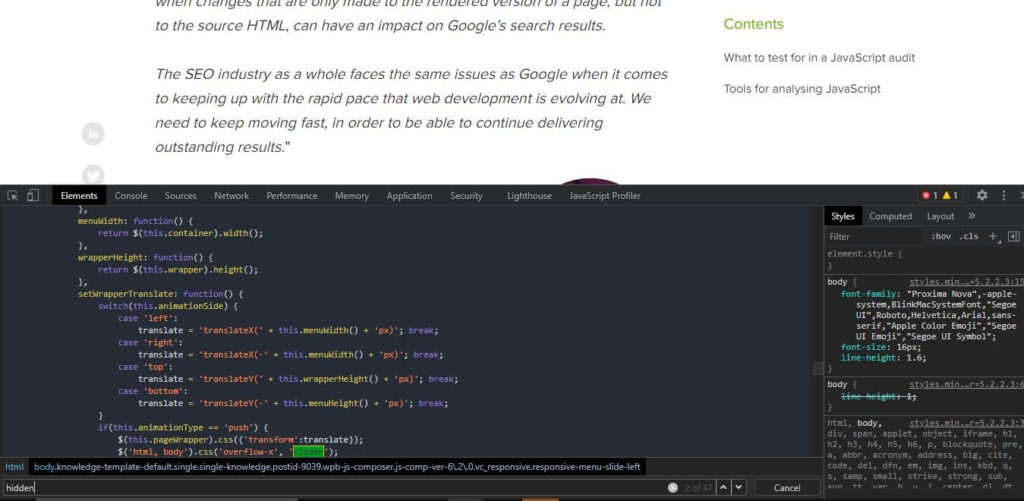
At times like this it would help if you open chrome web developer tool on a give web page go to elements and search for hidden to find anything deceptive.
Additionally you can search for <H1 because ideally you are supposed to use only one heading 1 tag on a page, and maybe it appears that way also only to find in devtools that there have been two H1 Tags this whole time targeting different keyphrase; the other one being hidden of course.
3. Find Unused JavaScript & CSS

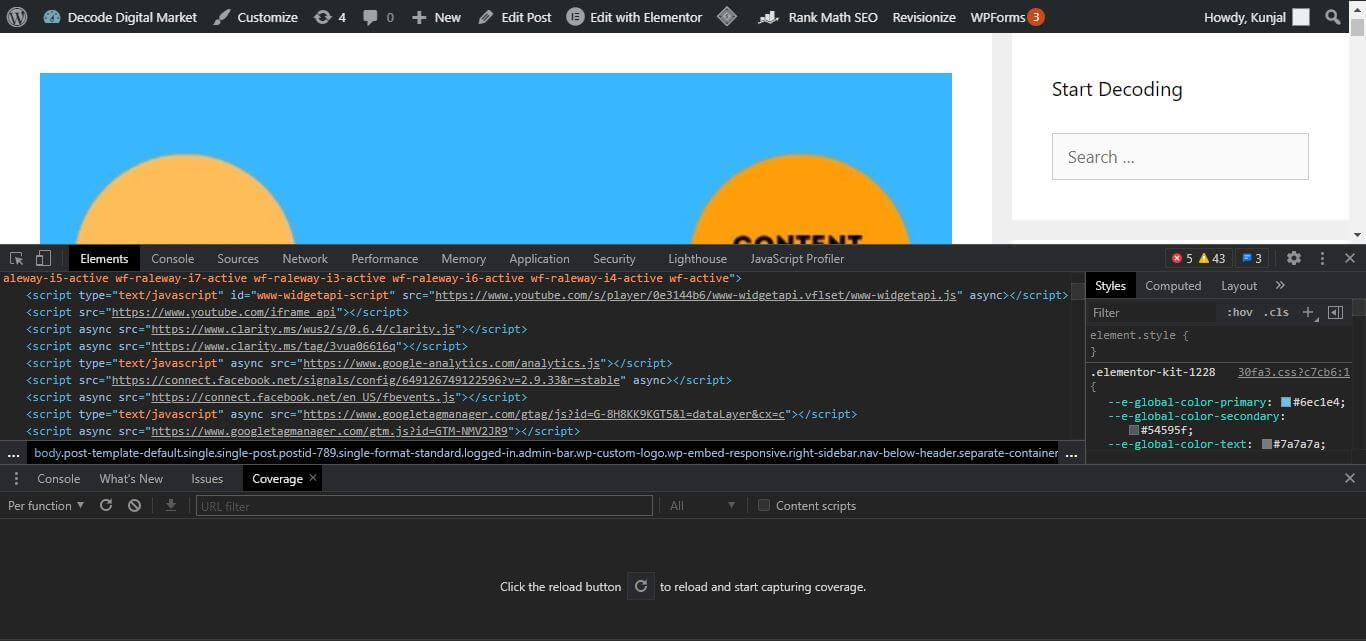
To look for unused JavaScript & CSS open the Chrome Web Devtools, go to elements and press ctrl+shift+P and type coverage; and then select [Show Coverage] as you can see in the above screenshot.
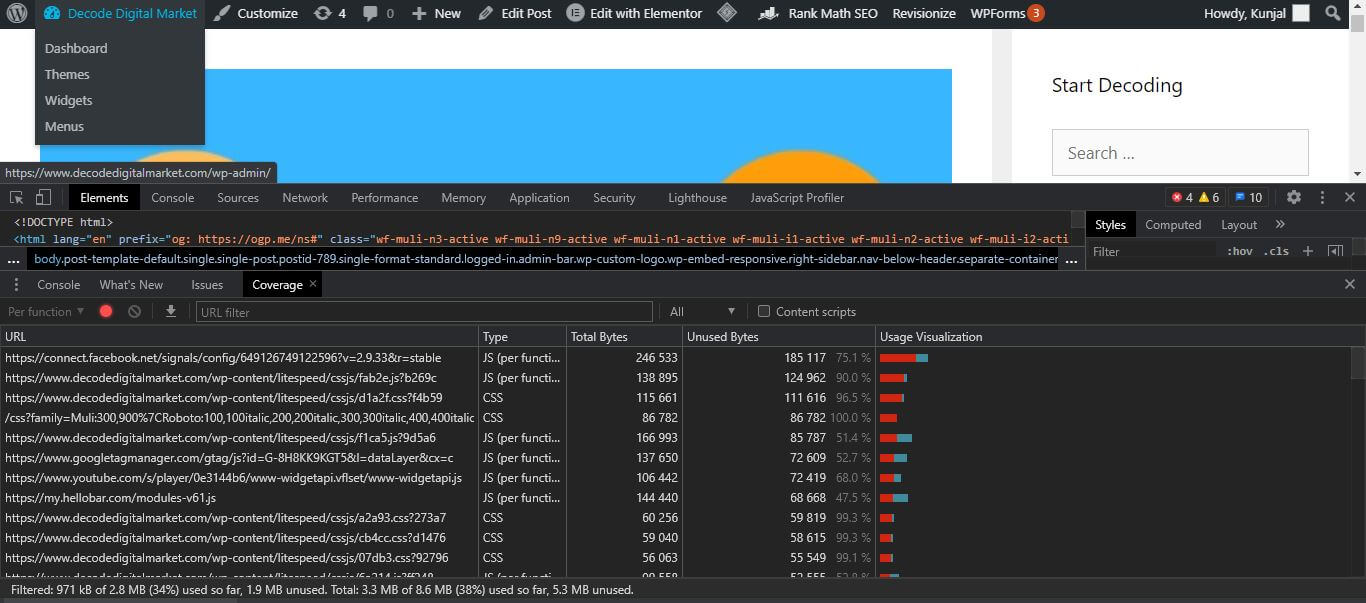
After selecting show coverage you will see the above screen, now you have to click on reload button as you can see in the screenshot and that will finally lead you to the coverage report that will show you the JS & CSS files.
Ta da!
Now you can see in this report, the red color in the bar is the unused JS & CSS.
You may consult with the developer to figure which of these scripts can be removed without breaking the website.
4. Switch User Agent in Chrome


As an SEO you want to make sure how certain visitors and bots may see your web page to ensure that the user experience is stunning.
How you are being able to see the webpage on your screen isn’t necessarily how it must appear on other user agents like Mozilla, Moto G, Google Bot Mobile, Firefox and more.
While create audits this is an important exercise to perform and find out meaningful insights.
The process to do the same is quite easy
a. Open the inspect element
b. Click 3 dots on the top right side
c. Click on more tools > network conditions
d. In the next screen at bottom you will find user agent automic checked, uncheck that and select the user agent of your choice and refresh the page to see how the page appears in that user agent.
5. View HTTP Header Status

While performing deep technical audits it’s important to assess each and every aspect of the website and this means checking if the HTTP header response is correct or is it redirecting to some place else or maybe you have got plenty of 404’s there.
Chrome Developer Tool’s this functionality will help you assess the header status of every page you can see for yourself if there are HTTP headers that aren’t responding the way they should.
a. Open DevTools
b. Go to Network
c. Hit refresh
d. Click on any item from the name column to see details about the header status
If you want to check header status of specific file type then you can choose from the options like JS, CSS, Img, Font, Doc and more.
6. View Network Waterfall
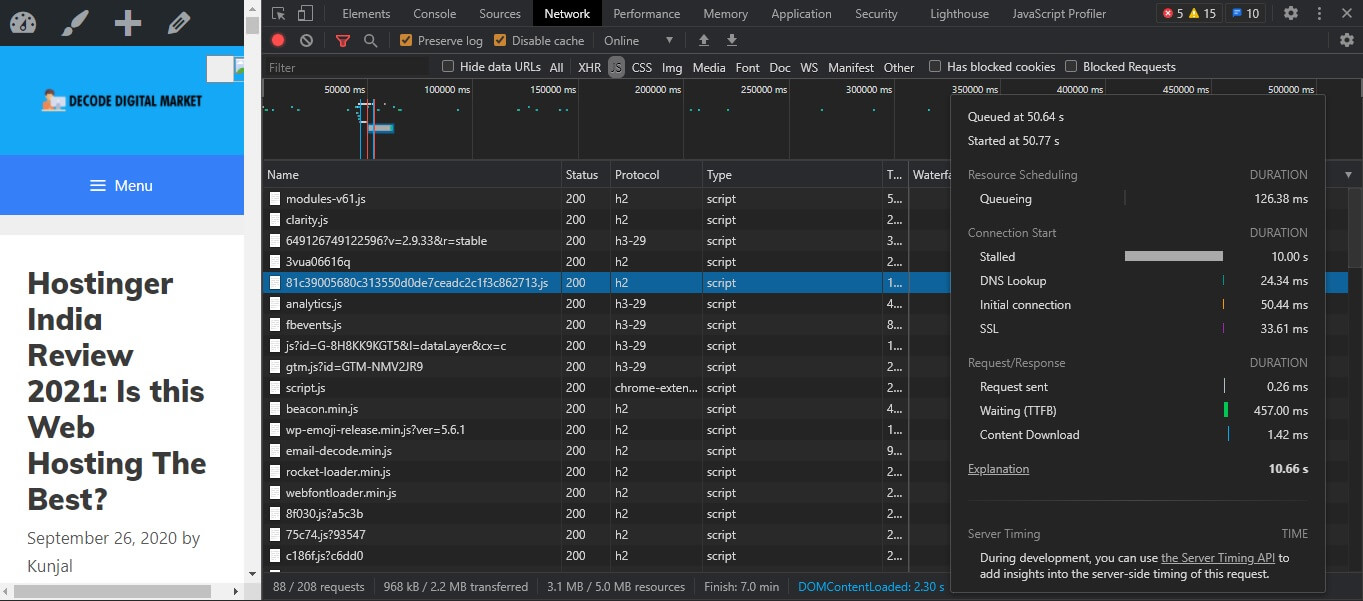
Note: There are two slides above
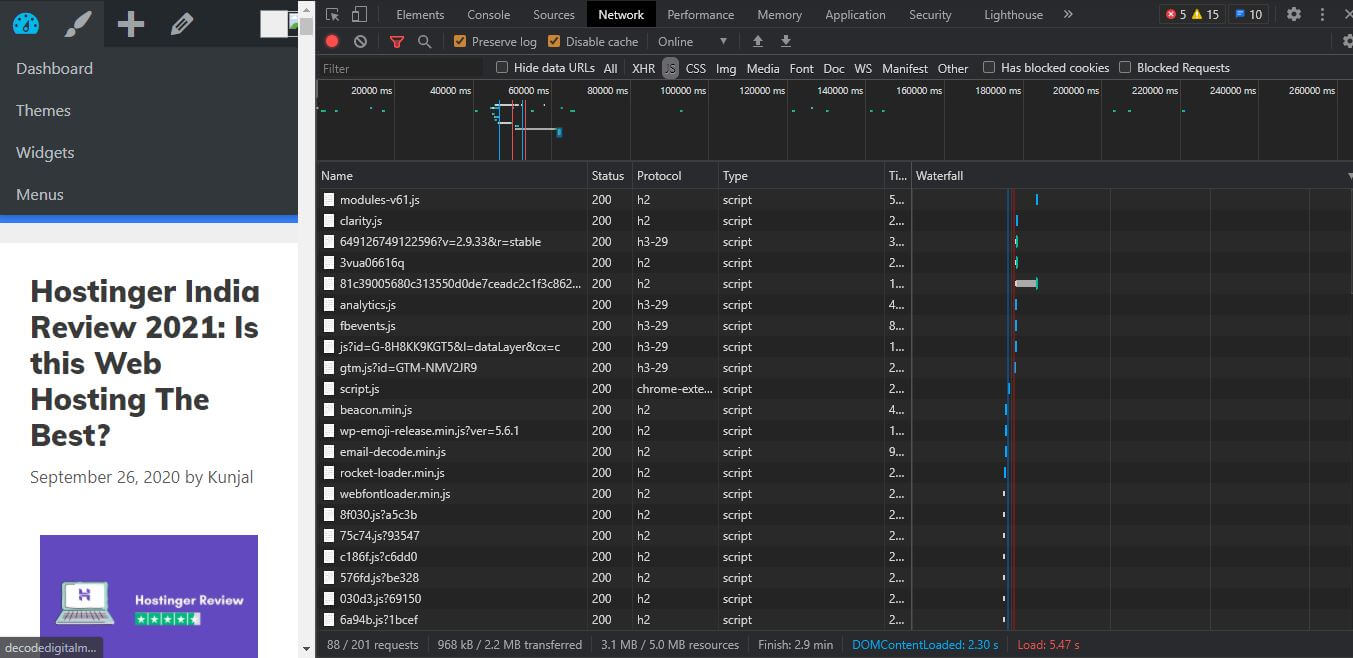
Network waterfall is one of the very crucial things you can do in Google Chrome Browser DevTools while performing audits or analyzing a web page for performance.
In the network waterfall it shows how much time a particular resource is taking to load. This is a go to way to identify the culprits that making your website a tortoise.
Perhaps you installed a plugin to gain a certain functionality for your website, let’s say you wanted a pop up subscription form; but how do you know if that plugin is dragging down the website speed? You can see how long the script is taking to load.
In fact, you can A/B test among many plugins to find the one that does the job & loads faster.
In the second slide, the script that I have selected is of Hellobar actually, 10 seconds is just the stall time for that which is huge and now I know what I need to do.
In the above example, I performed the network waterfall for JavaScript there are options for image, CSS, Fonts, Media and more. You can individually see for each.
How to do this?
a. Open DevTools
b. Go to Network
c. Reload the page
d. See the waterfall taking shape and resource getting loaded
e. See the insights on each resource
7. Identify where Core Web Vitals Elements are taking place


Core Web Vitals are all the rage right now.
It is important to debug these issues and fix before Google goes live with this in May 2021.
With Chrome DevTools you can exactly find at what area exactly CWV elements are triggering. CWV elements i.e. First Contentful Paint, Largest Contentful Paint and Cumulative Layout Shift.
a. First open DevTools
b. Go to Performance and click reload as shown in first screenshot
c. Stop the reload at 10 seconds
d. In the next screen you will see an option above “Web Vitals” check that box
e. Now you will see where First Contentful Paint is happening, where Layout Shift is happening. First Contentful Paint is Green Circle and layout shift is the red spade.
Getting this intel you can see often this is happening and chart a plan to optimize this and get your website Core Web Vitals ready.
8. Identify where it is taking longer to render

As an SEO you need to take special care of Javascript SEO.
Not paying attention to JavaScript SEO is like filling the bucket with water and becoming aware later that there was a hole in it which was causing a leakage preventing you from accomplishing your task.
JavaScript is in nearly every website today, when Google Bot renders your web pages it has hard time executing the JavaScript that’s why you will see warning in Google Pagespeed Insights ‘Reduce JavaScript Execution Time’
It is important to make it easier and faster for Google Bot render your webpages because every website has a dedicated render budget. Google Bot will pass and come back again to finish rendering your web pages which elongates the time it should take.
So, these are the 7 important things you can do with Chrome Devtools while creating Technical SEO Audits or routinely analyzing webpages for performance benchmarking.

Kunjal Chawhan founder of Decode Digital Market, a Digital Marketer by profession, and a Digital Marketing Niche Blogger by passion, here to share my knowledge